Discussion
In our science project, we collected six different water samples from the selected three rivers located on Vancouver’s North Shore: Brothers’ Creek, Capilano River and Mosquito Creek. For each river, one sample was taken upstream from the urban area, and one was taken downstream from the urban area, just before getting into Fraser River. Photo #..... shows all six samples that we got to the lab. All samples had a secure lid and had more than the minimum required of 1 L of water per sample.
Mosquito Creek water samples (MC1U and MC2D)
On our first river, Mosquito Creek, we collected two samples one upstream and one downstream which we labelled 1U and 2D. The upstream waters were moderately fast, while the downstream waters were flowing a bit slower. Then when we did the experiment in the lab, we filtered the two samples with filter 1 very clean after the filtering, and filter 2 very dirty. We found that the amount of solids collected on the filter (after drying) of samples 1 and 2 was 0.001 g and 0.068 g (or 1 mg and 68 mg), and that the volume of water we collected for samples 1 and 2 was 1.598 L and 1.286 L. Data is shown in Table 1 and Chart #1 under samples MC1U and MC2D. We also let each filter dry in the oven at 110 °C for exactly one hour. We made sure all samples were dried the same amount of time so that we can compare results. Concentrations for each sample were calculated by dividing the amount of solids to the volume of water, and it cam out 0.626 mg/L for sample MC1U, and 52.877 mg/L for sample MC2D. This shows an increase of suspended solids of 52.251 mg/L between the upstream and downstream locations, as shown also in Table 1 and Chart #2.
Capilano River water samples (CR3U and CR4D)
The next river water that we evaluated was Capilano River, with the upstream sampling point being at the fish hatchery in the Capilano River Regional Park. The upstream part of Capilano River was flowing relatively fast, while the downstream portion was very slow and calm and smoothly. The samples were labelled CR3U and CR4D (Capilano River 4th sample located Upstream, and 4th sample located Downstream). In the lab, they were filtered and sample 3U was very clean and sample 4D appearing to be somewhat clean. We found that the amount of solids collected on the filter (after drying) of samples 3 and 4 was 0.003 g in both, but the water sample volume was different; we collected for samples 3 and 4 an amount of 1.511 L and 1.445 L. Data is shown in Table 1 and Chart #1 under samples CR3U and CR4D.
Concentrations for each sample were calculated by dividing the amount of solids to the volume of water, calculated to be 1.985 mg/L for sample CR3U, and 2.076 mg/L for sample CR4D. This shows a very small increase of suspended solids of only 0.091 mg/L between the upstream and downstream locations, as shown also in Table 1 and Chart #2.
Water also appeared to have similar or less suspended solids in Capilano River than in Mosquito Creek.
Brothers Creek water samples (BC5U and BC6D)
The third and final river was Brothers Creek and the samples were labelled BC5U and BC6D. The upstream portion was flowing very fast and with a lot of splash, and the downstream was moderately fast, flowing under a bridge. The two water samples were filtered through their filters. Filter 5 was clean and filter 6 was almost as clean as filter 5. The amount of solids collected on the filters was 1 mg for filter 5, and 11 mg for filter 6. The water samples had a volume of 1.507 L for sample 5, and 1.411 L for sample 6. Data is shown in Table 1 and Chart #1 for samples BC5U and BC6D.
Concentrations for each sample were calculated by dividing the amount of solids to the volume of water, calculated to be 0.664 mg/L for sample BC5U, and 7.796 mg/L for sample BC6D. This shows a small increase of suspended solids between the upstream and downstream locations, as shown also in Table 1 and Chart #2. The increase was 7.132 mg/L.
Additional Discussion
During the lab experiment we’ve noticed that the filters weigh less when they are fully dry than before you dry them but the weights of each filter before and after are very close. The weights with the aluminum cups were 2.779g to 2.777g for filter 1, 2.803g to 2.8g for filter 2, 2.821g to 2.819g for filter 3, 2.818g to 2.815g for filter 4, 2.828g to 2.823g for filter 5, and 2.792g to 2.789g for filter 6. This shows that the very small filters had very little moisture in them and we needed to dry them before we use them. Also the filters and the aluminium cups had more or less the same weights and that the weight scale was working properly.
We also noted that the concentrations of suspended solids (Table 1 and Chart #2) have increased in all three rivers between the upstream and downstream locations (before and after the urban areas), with the largest increase noted for Mosquito Creek, followed by Brothers Creek, and by Capilano River. Urban areas are very similar (in North Vancouver and West Vancouver) and it is possible that the differences in suspended solids concentrations were due to the surface area around each sampling location and river. It also depends on how fast the river is flowing on that day.
Possible errors in the lab could have slightly affected the results of the experiment. For the controlled variables:
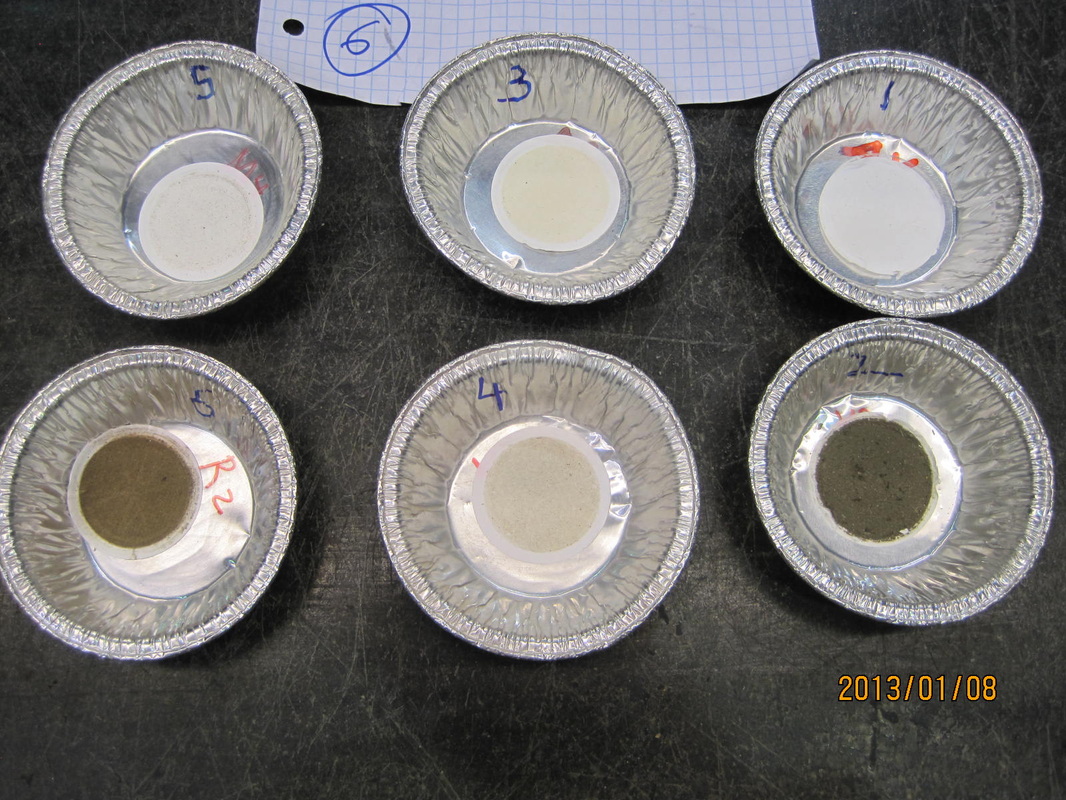
The photo shown below shows the six filtered samples in a tray, after the drying in the oven, at the end of the experiment. It is noted the change in color between samples. Top samples were upstream and bottom samples were downstream.
Mosquito Creek water samples (MC1U and MC2D)
On our first river, Mosquito Creek, we collected two samples one upstream and one downstream which we labelled 1U and 2D. The upstream waters were moderately fast, while the downstream waters were flowing a bit slower. Then when we did the experiment in the lab, we filtered the two samples with filter 1 very clean after the filtering, and filter 2 very dirty. We found that the amount of solids collected on the filter (after drying) of samples 1 and 2 was 0.001 g and 0.068 g (or 1 mg and 68 mg), and that the volume of water we collected for samples 1 and 2 was 1.598 L and 1.286 L. Data is shown in Table 1 and Chart #1 under samples MC1U and MC2D. We also let each filter dry in the oven at 110 °C for exactly one hour. We made sure all samples were dried the same amount of time so that we can compare results. Concentrations for each sample were calculated by dividing the amount of solids to the volume of water, and it cam out 0.626 mg/L for sample MC1U, and 52.877 mg/L for sample MC2D. This shows an increase of suspended solids of 52.251 mg/L between the upstream and downstream locations, as shown also in Table 1 and Chart #2.
Capilano River water samples (CR3U and CR4D)
The next river water that we evaluated was Capilano River, with the upstream sampling point being at the fish hatchery in the Capilano River Regional Park. The upstream part of Capilano River was flowing relatively fast, while the downstream portion was very slow and calm and smoothly. The samples were labelled CR3U and CR4D (Capilano River 4th sample located Upstream, and 4th sample located Downstream). In the lab, they were filtered and sample 3U was very clean and sample 4D appearing to be somewhat clean. We found that the amount of solids collected on the filter (after drying) of samples 3 and 4 was 0.003 g in both, but the water sample volume was different; we collected for samples 3 and 4 an amount of 1.511 L and 1.445 L. Data is shown in Table 1 and Chart #1 under samples CR3U and CR4D.
Concentrations for each sample were calculated by dividing the amount of solids to the volume of water, calculated to be 1.985 mg/L for sample CR3U, and 2.076 mg/L for sample CR4D. This shows a very small increase of suspended solids of only 0.091 mg/L between the upstream and downstream locations, as shown also in Table 1 and Chart #2.
Water also appeared to have similar or less suspended solids in Capilano River than in Mosquito Creek.
Brothers Creek water samples (BC5U and BC6D)
The third and final river was Brothers Creek and the samples were labelled BC5U and BC6D. The upstream portion was flowing very fast and with a lot of splash, and the downstream was moderately fast, flowing under a bridge. The two water samples were filtered through their filters. Filter 5 was clean and filter 6 was almost as clean as filter 5. The amount of solids collected on the filters was 1 mg for filter 5, and 11 mg for filter 6. The water samples had a volume of 1.507 L for sample 5, and 1.411 L for sample 6. Data is shown in Table 1 and Chart #1 for samples BC5U and BC6D.
Concentrations for each sample were calculated by dividing the amount of solids to the volume of water, calculated to be 0.664 mg/L for sample BC5U, and 7.796 mg/L for sample BC6D. This shows a small increase of suspended solids between the upstream and downstream locations, as shown also in Table 1 and Chart #2. The increase was 7.132 mg/L.
Additional Discussion
During the lab experiment we’ve noticed that the filters weigh less when they are fully dry than before you dry them but the weights of each filter before and after are very close. The weights with the aluminum cups were 2.779g to 2.777g for filter 1, 2.803g to 2.8g for filter 2, 2.821g to 2.819g for filter 3, 2.818g to 2.815g for filter 4, 2.828g to 2.823g for filter 5, and 2.792g to 2.789g for filter 6. This shows that the very small filters had very little moisture in them and we needed to dry them before we use them. Also the filters and the aluminium cups had more or less the same weights and that the weight scale was working properly.
We also noted that the concentrations of suspended solids (Table 1 and Chart #2) have increased in all three rivers between the upstream and downstream locations (before and after the urban areas), with the largest increase noted for Mosquito Creek, followed by Brothers Creek, and by Capilano River. Urban areas are very similar (in North Vancouver and West Vancouver) and it is possible that the differences in suspended solids concentrations were due to the surface area around each sampling location and river. It also depends on how fast the river is flowing on that day.
Possible errors in the lab could have slightly affected the results of the experiment. For the controlled variables:
- If the quantity of water in the beaker was not properly read than the concentration of suspended solids could be slightly different. However, this would not change the results and conclusions of the project, because the change is too small.
- If sampling procedures was different then there would be a difference in the amount of suspended solids, for example the containers if the containers were to low in the water then sediments would enter the container and effect the amount solids it the sample.
- If the sample was keep to long out of the oven before being weighted then the sample would collect moisture and then the weight of the sample would not reflect the dry solids.
The photo shown below shows the six filtered samples in a tray, after the drying in the oven, at the end of the experiment. It is noted the change in color between samples. Top samples were upstream and bottom samples were downstream.